
VENUE STATISTICS
Providence Stadium, Guyana
1st innings average score: 148
Match Played: 15 1st batting team won: 6 2nd batting team won: 9
Highest Score: England 191/5 Lowest Score: Uganda 39/10


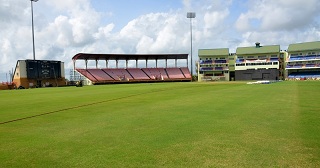
Home Team: Guyana Amazon Warriors
Capacity: 15,000
End names: Media Centre End, Pavillion End
Its always been a typically slow surface, with assistance for the spinners. So bowling first could have its advantages. Going by the slowness of the wicket, chasing could prove equally challenging
1st innings average score: 148
Match Played: 15 1st batting team won: 6 2nd batting team won: 9
Highest Score: England 191/5 Lowest Score: Uganda 39/10
Head to Head Match Played: 0 England won: 0 India won: 0
TOTAL MATCH PLAYED
England: 1 Won: 0
India: 3 Won: 2
Below Score 150: 6
Score between 150 and 169: 5
Score between 170 and 189: 3
Above Score 190: 1
Disclaimer: The information contained in this website is for entertainment only for Cricket lovers. sportsf1.com is not an online gambling operator, or a gambling site of any kind. We are not responsible the completeness, accuracy, reliability, suitability or availability with respect to the website or the information contained on the website for any purpose.